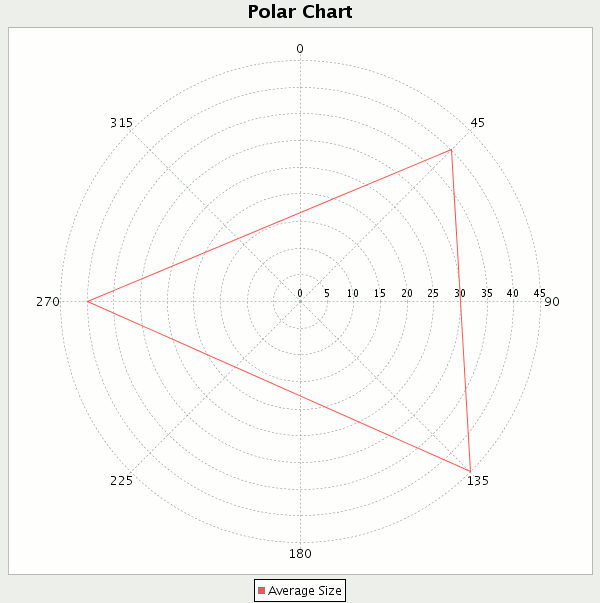
Create a polar chart using JFreeChart


This Example shows you how to create a polar chart using JFreeChart. Code given below creates a simple
polar chart
for the given values. In the code given below we have extended class ApplicationFrame to create a frame and also pass a string value to the constructor of
ApplicationFrame class by using super keyword that will be name of the created frame.
Methods used in this example are described below:
pack(): This method invokes the layout manager.
centerFrameOnScreen(): This method is used for the position of the frame in the middle of the screen.
setVisible(): This method is used for display frame on the screen.
createCategoryDataset(): This method is used to create the instance of CategoryDataset Interface and that contains a copy of the data in an array.
createPolarChart(): This method is used to create bar chart for given values. It
takes title, dataset, legend, tool tips and urls as parameters.
saveChartAsPNG(): This method is used to save chart in to png format.
PolarChart.java
import org.jfree.chart.ChartFactory;

import org.jfree.chart.ChartPanel;

import org.jfree.chart.JFreeChart;

import org.jfree.data.xy.XYDataset;

import org.jfree.data.xy.XYSeries;

import org.jfree.data.xy.XYSeriesCollection;

import org.jfree.ui.ApplicationFrame;

import org.jfree.ui.RefineryUtilities;


public class PolarChart extends ApplicationFrame {


  public PolarChart(String titel) {

  super(titel);


  XYDataset dataset = createDataset();

  JFreeChart chart = createChart(dataset);


  ChartPanel chartPanel = new ChartPanel(chart);

  chartPanel.setPreferredSize(new java.awt.Dimension(600, 600));

  setContentPane(chartPanel);

  }


  private XYDataset createDataset() {

  final XYSeriesCollection data = new XYSeriesCollection();

  XYSeries series = new XYSeries("Average Size");

  series.add(45, 40.0);

  series.add(135.0, 45.0);

  series.add(270.0, 40.0);

  data.addSeries(series);

  return data;

  }


  private JFreeChart createChart(XYDataset dataset) {

  JFreeChart chart = ChartFactory.createPolarChart(

  "Polar Chart", dataset, true, true, false

  );

  return chart;

  }


  public static void main(final String[] args) {

  PolarChart chart = new PolarChart("Polar Chart");

  chart.pack();

  RefineryUtilities.centerFrameOnScreen(chart);

  chart.setVisible(true);

  }

}
|
Output:

Download
code


